Clouds over your viewing spot
Choose a spot to compare the next 12 hours.
Waiting for weather…
Choose a country, compare the clouds, and find a place to look up. This is the planning desk behind the photographs, with a live aurora model and weather forecasts to help you decide where to begin.
Northern cities, regions and viewing spots. Area pins are approximate forecast references; they do not confirm parking or safe access.
Showing all viewing spots.
See matching map pinsWalk estimates are one way from each card’s named starting point, not your hotel. Snow and ice can add time. Green pins: nearby walking options · violet pins: drive-first spots. Pins mark approximate viewing access locations, not surveyed parking bays.
Loading forecast sources…
Auto-checks every 3 minutes · click a country to check againLocal date and time at each spot, with the current-hour weather forecast. These are model forecasts, not live weather-station observations.
Checking what this means…
Model signal is shown independently of cloud cover.Checking what this means…
Planetary geomagnetic activity, not local visibility.Checking what this means…
Current G scale, separate from solar radiation storms.Checking what this means…
Upstream measurements, not conditions at ground level.Checking what this means…
A southward Bz can favour energy transfer; it is not a sighting guarantee.Aurora can be visible in Lapland without a major geomagnetic storm. A weak overhead model cell does not rule out aurora near the horizon. Kp, G scale and solar wind measurements describe different things and time periods.
Forecasts are model estimates, not confirmed sightings. Markers distinguish local viewing spots and approximate regional forecast references. Area pins are not verified parking or access points. Darkness descriptions are qualitative, not measured light-pollution ratings. The map currently covers Iceland, Norway, Finland and Sweden. A clear forecast cannot guarantee aurora or safe access.
Live source data appears here. Observation charts look backwards; the cloud chart looks ahead. None is a guaranteed sighting probability.
Choose a spot to compare the next 12 hours.
Observed 3-hour Kp intervals over the last 48 hours · global activity, not local brightness.
Active spacecraft measurements over the last 3 hours. Faster wind alone does not guarantee aurora.
Last 3 hours · negative Bz is southward and can support stronger coupling. It does not predict a display by itself.
NOAA SWPC supplies Kp, solar wind, magnetic field and the auroral model. MET Norway or Open-Meteo supplies weather. Sun and moon positions are calculated locally. Each chart shows its time range; missing observations leave gaps. Cloud cover is the forecast proportion of sky covered, not a percentage chance of aurora. The planning score combines weather, darkness, moonlight and the near-term aurora model; it is not calibrated against confirmed sightings.
Cloud layers, darkness, moon altitude, wind and the local auroral model are being compared.
We compare the marked areas only, not every location in the country. The near term shortlist uses weather within 30 minutes of NOAA’s model time, at most 90 minutes ahead. Sun and moon positions come from SunCalc. Cloud, darkness, moon contrast and wind are combined with the nearest NOAA grid value. The score is an uncalibrated planning heuristic, never a percentage chance of seeing aurora. Heavy cloud, bright twilight, precipitation or strong wind blocks a positive suggestion. No road safety or live sighting data is included.
The later window below ranks weather and darkness over 12 hours. It makes no prediction of auroral activity that far ahead. Access notes describe local lights and approximate travel; the forecast score does not model terrain, actual walking routes or driving time. Check access and official warnings before travelling.
Looking for darkness and clearer clouds over the next 12 hours. Aurora activity must be checked again nearer the time.
The optional NOAA layer shows model grid intensity, not confirmed sightings. The map updates its area colours after forecasts load.
Area markers are approximate planning references. Use Google Maps to inspect access and parking. Respect closures, private land, tide restrictions and road conditions. No live sighting reports have been added.
Choose a map pin to calculate the moon direction.
The line points towards the moon from your spot. It is a compass bearing, not a route or a place to travel to. Hills and trees can block the actual horizon.
Live-provider players; press play if needed. Check the camera’s displayed time. Snow, daylight, clouds or an offline feed can hide the sky; no aurora detection is inferred from these videos.
City of Rovaniemi · village-square camera, not an all-sky aurora camera. Official camera / fallback
Lights Over Lapland · direct provider player. Official cameras / fallback
Landhotel · southern Iceland · provider live-camera player · Official source / player fallback
Spåkenes · stream listed by Visit Lyngenfjord · Official source / player fallback
Aurora Alert Realtime · Rovaniemi sky camera · Official source / player fallback
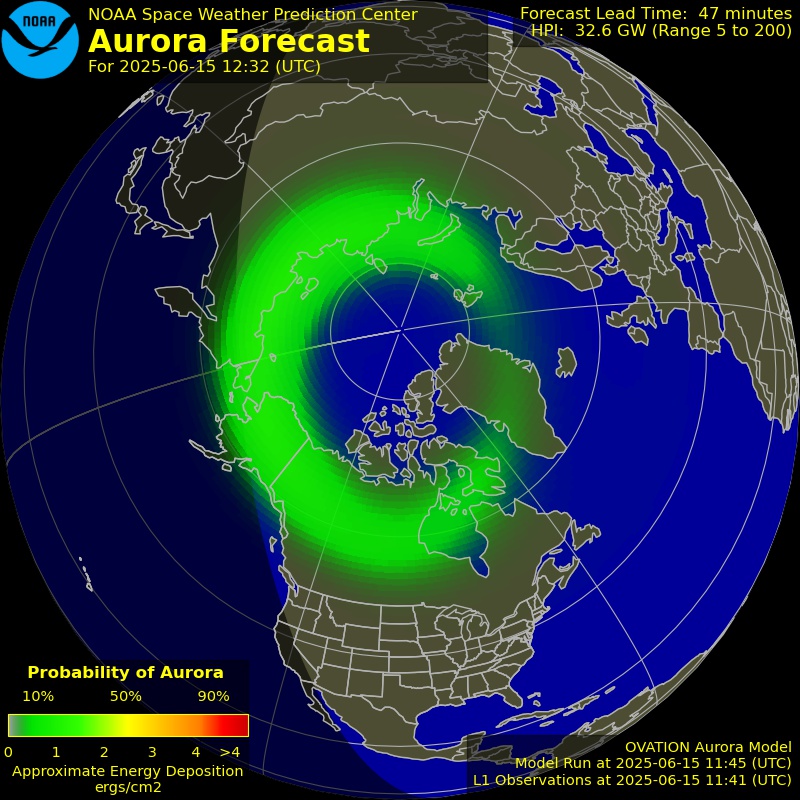
NOAA OVATION models auroral location and intensity. It usually offers about 30 to 90 minutes of lead time; fallback inputs can remove that lead. It does not include local cloud cover, landscape or your eyesight. Read the timestamp on the image.
Open NOAA forecastUse Windy’s time controls to compare cloud movement. Surface wind direction in the table is where the wind comes from; it is not a prediction of how every cloud layer will move.
Open cloud mapTimes use the selected location’s time zone. Darkness here means the model labels the hour as night; twilight may still be too bright. Cloud cover percentages describe forecast sky coverage, not your chance of seeing aurora.
Compare low, middle and high clouds, then watch the next few forecast hours. A small clear patch nearby can be more useful than a bigger activity number under solid cloud.
Moonlight can soften a faint display and illuminate a beautiful foreground. Check whether the moon is above the horizon. A bright moon is not an automatic reason to stay inside.
Find legal, safe access away from bright lamps and let your eyes adjust. Keep checking the sky between pictures. If you drive, check local warnings and the return journey before setting out.
The forecasts help me choose a direction. What happens out there is why I keep coming back.
Sources: NOAA SWPC, weather by MET Norway and Open-Meteo (CC BY 4.0), cloud map by Windy, maps © OpenStreetMap contributors, map interface Leaflet. Weather is requested on country selection and cached for up to five minutes; refresh does not bypass provider cache. If a source fails or is stale, its values are not presented as current. Sun and moon positions use SunCalc 1.9.0, © Vladimir Agafonkin, BSD 2 Clause. Calculations are approximate and do not include terrain. No geolocation permission is requested.